BUSINESS NEWS - At the start of 2002, South African investors could be forgiven for feeling confused. The previous five years had produced a remarkable sequence of returns on the JSE.
As the table below indicates, after two years of going backwards due to the emerging markets crisis, the FTSE/JSE All Share Index (Alsi) surged with the internet boom in 1999, only to come back to earth in 2000. In 2001, the local market rose sharply once again, defying the fall in global stocks as the dotcom bubble burst.
| FTSE/JSE All Share Index returns by year | |
| 1997 | -4.5% |
| 1998 | -10% |
| 1999 | 61.4% |
| 2000 | 0% |
| 2001 | 29.3% |
| Five-year annualised | 12.4% |
What was even more at the forefront of investors’ minds, however, was the performance of the local currency. In this same five-year period, it had blown out from under R5 to the dollar to R12.40.
At the height of this extreme movement in the exchange rate, many South Africans were rushing to get money offshore. Spurred by the belief that the collapse in the rand was irreversible, they believed the best way to preserve their wealth was to get it into hard currency. That meant abandoning the local market.
Gaining perspective
There were however a number of local investment professionals arguing that this was not the right course of action. It didn’t fit with the fundamentals – most obviously the difference in the prevailing price-to-earnings (PE) multiples between the local and US markets.
“The S&P 500 average PE was over 40 times at the time,” notes Adrian Clayton, chief investment officer at Northstar Asset Management. “This meant that at the rate at which companies in the US were growing their profits, it would have taken an investor 40 years to make back the money invested in that market. In addition, many US companies were on elevated profit levels, adding a risk that these would falter.
“By contrast, the majority of high-quality South African companies in 2002 could have been purchased on depressed yet rising levels of profitability and on PEs below 10,” he adds.
“This meant that in a ‘worst-case’ outcome, an investor’s payback period was only 10 years.”
This was however largely being lost in the fear around the currency. Yet a rational analysis of the rand should have given investors something to think about as well.
“In 2002, the rand reached a level of R12.50 to the US dollar, but based on purchasing power parity [PPP], should not have exceeded R7,” Clayton notes.
As the graph below shows, the blowout in the currency was clearly overdone if one considered this measure.
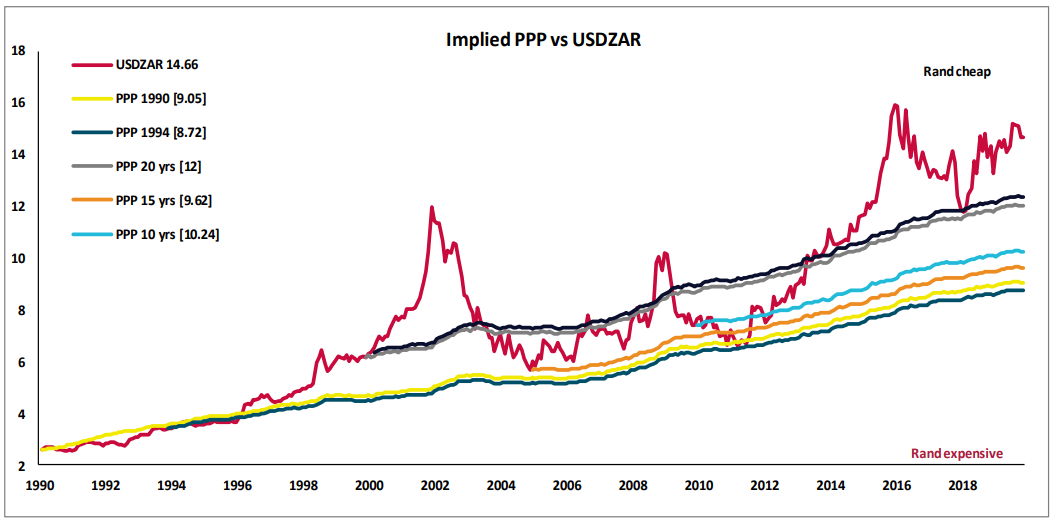
Source: Bloomberg and Northstar Asset Management
The streak
What happened next is now a matter of historical record. Although 2002 was a disappointing year on the JSE, from the start of 2003 the local market went on one of the greatest five-year streaks in its history.
| FTSE/JSE All Share Index returns by year | |
| 2003 | 16.1% |
| 2004 | 25.4% |
| 2005 | 47.3% |
| 2006 | 41.2% |
| 2007 | 19.2% |
| Five-year annualised | 29.3% |
To put that in nominal terms, an amount of R100 invested in the Alsi at the start of this period would have grown to R430 by the end of it. Over the same time, the rand strengthened back to R6.80 to the dollar, seriously denting the wealth of many investors who had been unfortunate enough to go offshore at the wrong time.
This outperformance of local assets also continued for another five years.
“The Alsi gained 400% from March 2002 to March 2012,” Clayton points out. “Comparatively, the S&P 500 returned 65% and the Nasdaq 121% in US dollar terms. Investors failing to grasp the unique opportunity in South Africa incurred a decade of significant negative currency effects, while simultaneously being exposed to equities which grossly underperformed a rampant JSE.”
Is history repeating itself?
The parallels between where we were in 2002 and the current market environment are obvious. The US market is looking expensive, the JSE is depressed, and the rand is cheap on a PPP basis.
“Current PE multiples generate a distinct sense of déjà vu,” says Clayton. “However, there is a significant difference between the two periods.”
That is the state of the South African economy.
In 2002, South Africa’s GDP growth rate was 3.7%, which was healthier than the growth in similar commodity-producing economies Brazil and Canada.
“The real economy was robust, systems of government were operating smoothly, companies were investing, consumers were spending, and hope was high,” Clayton recalls.
This is certainly not the case today. South Africa is barely registering positive real GDP growth, and that has implications for local businesses. As the graph below shows, earnings on the JSE have historically followed the performance of the economy.
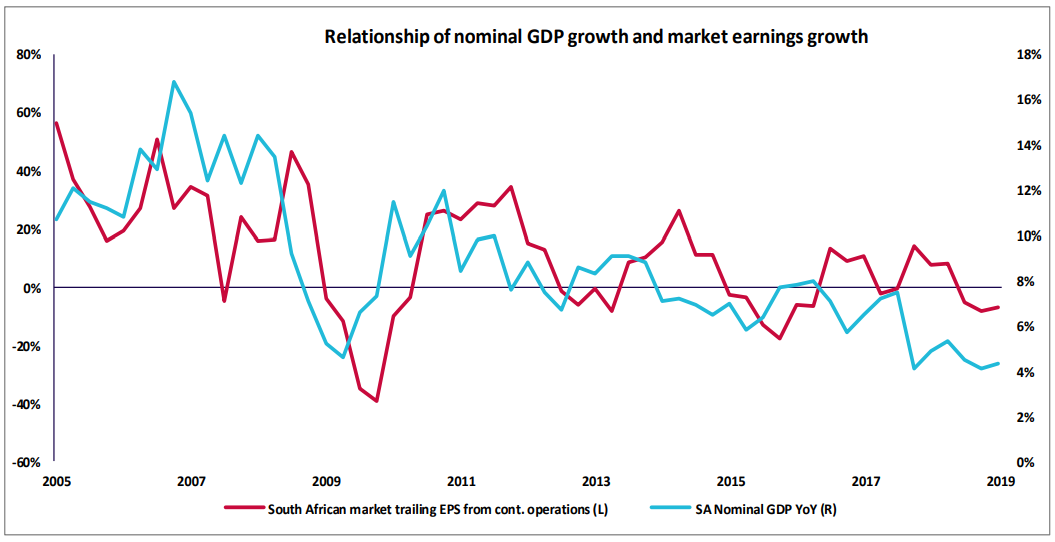
Source: Bloomberg and Northstar Asset Management
What should investors be thinking?
This means it is harder to rely on a statistical measure like the market PE because company profits cannot be relied upon. As Truffle Asset Management portfolio manager Saul Miller pointed out recently, the opportunity on the JSE cannot be viewed in the same way it has historically because the environment is structurally different.
For Clayton, this leaves investors in a conundrum.
“The numbers indicate that South African assets are preferable versus offshore assets,” he says. “But it is clear that traditional valuation frameworks are being rendered increasingly irrelevant by the tectonic economic shifts in South Africa and current dire state of affairs.”
In this environment, prudence remains the best approach.
“Essentially our view is that it is difficult to argue against finding a balance,” Clayton says. “We are convinced that a portfolio of both domestic and offshore assets makes more sense than ever.”