
The following 4 indices have been used for this market recap:
- South Africa Listed Property Index – gives us insight into the state of South African property - shopping malls and office space across the country. Large exposures here include Growthpoint and Redefine Properties
- JSE All Share Index – Represents our local equity market.
- MSCI World Index – Represents all developed world markets. About 67% of this index is made up of the US market.
- JSE All Bond Index – Provides a sense of how our bond market is performing, which is useful as it shows the type of low-risk returns we can lock in for short-term or conservative investing.
The chart below shows all 4 of these indices going back to 2006:
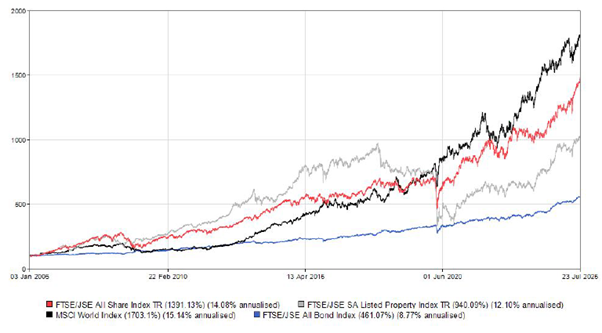
Some observations
The South African property market significantly outperformed both our local equity market and international markets from 2006 to 2018, even delivering better returns than the US market during that period.
A dramatic crash in property stocks began around 2018. Contributing factors included:
- Massive corruption uncovered during the Zuma years and the impact of state capture.
- A growing fiscal deficit / spending too much– our debt-to-GDP ratio rose from about 26% to 70% since 2010.
- The onset of loadshedding and the breakdown of municipal infrastructure around the country. Load shedding In particular was highly damaging to the economy.
The JSE initially outperformed global developed markets until around 2015. A significant factor driving this growth was the commodity cycle — our mining companies delivered annualised returns of around 20% during this period. This boom also led to far higher tax collections for National Treasury.
While Tito Mboweni and Trevor Manuel often take credit for the era’s fiscal discipline and budget surpluses, the underlying driver was largely elevated commodity prices.
From that point, global markets surged while our local market stalled. However, most of the gains offshore were narrowly concentrated, driven primarily by the US technology sector, with the FAANG stocks (Facebook, Apple, Amazon, Netflix, and Google) leading the charge.
In fact, many other regions including the EU, UK, Australia, and even China also stagnated during this period. Meaningful returns were largely confined to a handful of US tech stocks.
The JSE Bond Index, while far more stable, dramatically underperformed all other asset classes, even South African property.
The next chart highlights the past 10 years of returns for these indices:
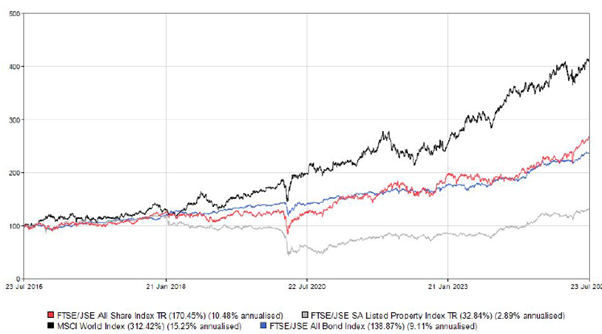
Observations:
- Offshore markets significantly outperformed over the past decade.
- SA property was flat overall — with five years of negative returns leading up to 2020. However, from the depths of the COVID crash, the sector began a recovery that delivered approximately 15% annualised growth from 2020 to 2025.
- Local equities only slightly outperformed bonds – a rare period, which also shows how attractive our local bond yields have been.
The following chart covers the past 5 years:
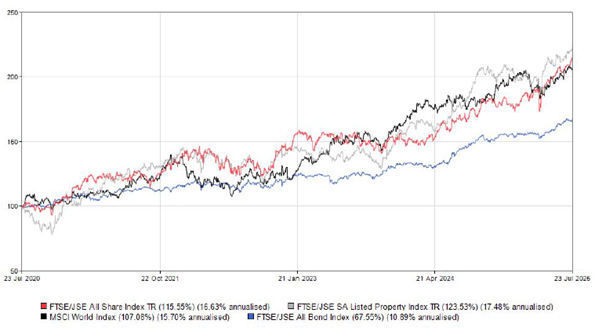
Observations:
- Returns have been more in line with long-term averages, albeit slightly higher (long-term averages for equities are around 13%, compared to ~15% annualised in this period).
- It’s normal to see strong periods following weaker ones – for example, poor returns from 2015 to 2020 were followed by this stronger performance.
- Interestingly, our local listed property market has delivered over 15% per year over the past 5 years.
Finally, the chart below shows the past year’s performance:
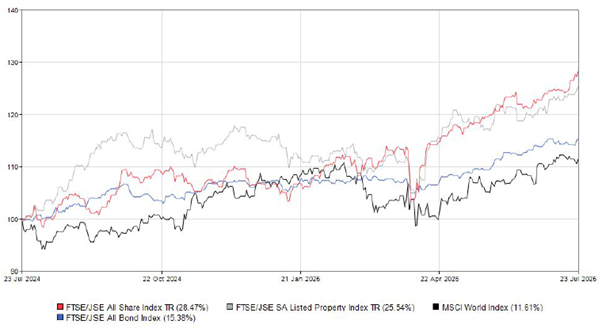
The local All Share Index has been exceptional, returning almost 30%. Our property sector also performed strongly, with a return of around 25%.
Following the exceptional performance of US markets over the past decade, very few investors were allocating meaningfully to local sectors. It will be fascinating to see what will happen to these indexes over the next 5 years.

Matthew Matthee has a wealth management business that specialises in retirement planning and investments. He writes about financial markets, investments, and investor psychology. He holds a Masters Degree in Economics from Stellenbosch University and a Post Graduate Diploma in Financial Planning from UFS. MatthewM@gravitonwm.com
‘We bring you the latest Garden Route, Hessequa, Karoo news’